 |
Oxygen calibration - DatLab |
MitoPedia O2k and high-resolution respirometry:
O2k-Open Support
Description
O2 calibration is the calibration in DatLab of the oxygen sensor. It is a prerequisite for obtaining accurate measurements of respiration. Accurate calibration of the oxygen sensor depends on (1) equilibration of the incubation medium with air oxygen partial pressure at the temperature defined by the experimenter; (2) zero oxygen calibration; (3) high stability of the POS signal tested for sufficiently long periods of time; (4) linearity of signal output with oxygen pressure in the range between oxygen saturation and zero oxygen pressure; and (5) accurate oxygen solubility for aqueous solutions for the conversion of partial oxygen pressure into oxygen concentration. The standard oxygen calibration procedure is described below for high-resolution respirometry with the calibration routine using instrumental calibration DL-Protocols in DatLab.
Reference: MiPNet06.03 POS-calibration-SOP, MiPNet12.20_O2k-calibration_tutorial
Oxygen calibration in instrumental and experimental DatLab files
- Instrumental calibration
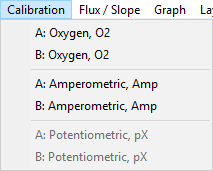
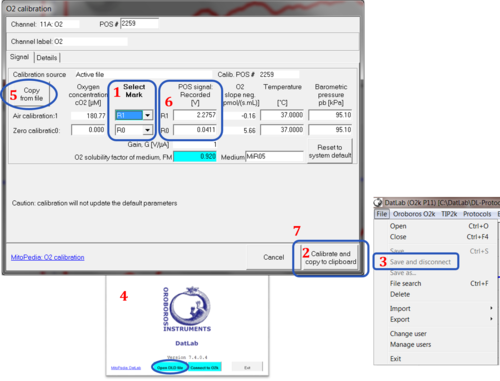
- It is common practice to save instrumental calibration tests in separate DatLab files, which include (1) air calibration and zero oxygen calibration in the same calibration file, or (2) air calibration and zero oxygen calibration in different calibration files. Step 1: Select calibration sections from Marks (R1, R0) while DatLab is connected to the O2k during an instrumental calibration run. Step 2: Click on Calibrate and copy to clipboard in the O2 calibration window (in menu 'Calibration' > 'Oxygen, O2'). Step 3: Click on Save and disconnect in menu File. The calibration file is saved, and DatLab disconnects from the O2k.
- Instrumental calibration
- Calibration parameters are automatically transferred to experimental DatLab files
- Step 4: When a new DatLab file is recorded any time later, the latest calibration parameters are automatically applied in the new DatLab file — independent of maintaining the O2k in operation or switching it off, and independent of maintaining DatLab active or re-opening it after exit.
- Calibration parameters are automatically transferred to experimental DatLab files
- A calibration can be performed and calibration parameters saved during an experimental run
- In the specific case of an experiment that involves an aerobic-anoxic transition, zero oxygen calibration is performed within the experimental file, setting a Mark (R0) on the oxygen signal in the anoxic section, and clicking on Calibrate and copy to clipboard in the O2 calibration window (in menu 'Calibration' > 'Oxygen, O2').
- A calibration can be performed and calibration parameters saved during an experimental run
- Calibration parameters can be selectively imported from any DatLab file
- Step 5: In addition, the calibration parameter for air calibration, zero oxygen calibration, or both can be imported from a selected DatLab file. This is particularly important, if a zero calibration is performed after completion and saving an experimental file. Step 6: A single calibration value (R1 or R0) can be edited manually. Take Step 7 to apply the selected calibration parameters.
- Calibration parameters can be selectively imported from any DatLab file
Instrumental DL-Protocols
Instrumental DL-Protocols guide the O2k operator step-by-step through the calibration procedure, adding automatically the event names and mark names set during the calibration run.
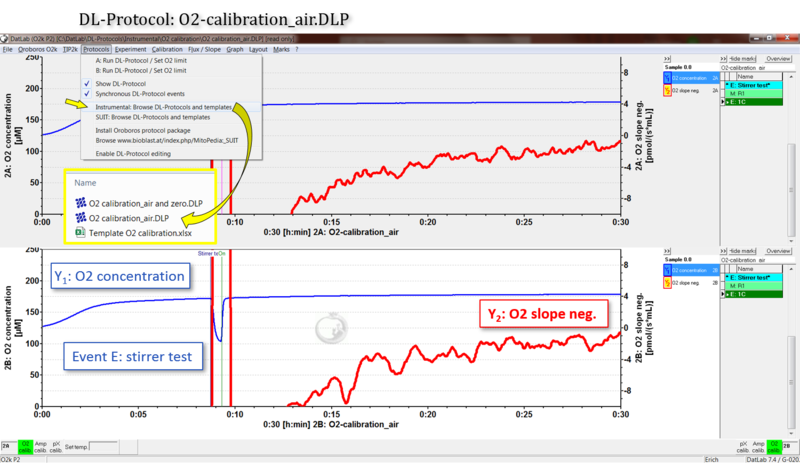
Air calibration: O2-calibration_air.DLP
- O2 sensor test and calibration at air saturation: Performed routinely every day before starting measurements.
- Event E: Stirrer test*
- 1 - Perform a stirrer test [F9], even before final equilibration.
- Both stirrers are switched off automatically for 30 s (default).
- Re-start of the stirrers is automatic (automatic event: On).
- The increase of the O2 signal should be rapid and monoexponential.
- 2 - Proceed with mark R1.
- 1 - Perform a stirrer test [F9], even before final equilibration.
- Event E: Stirrer test*
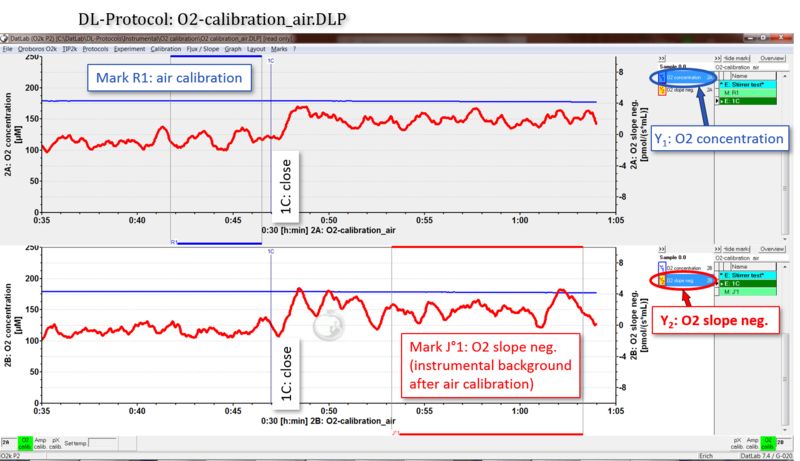
- Mark M: R1 - air calibration
- 1 - After the stirrer test, the signal should stabilize within 40 min.
- O2 slope neg. should approach zero, at ± 1 pmol∙s−1∙mL−1.
- Noise: An 'O2 slope neg.' within ± 2 pmol∙s−1∙mL−1 is optimal (± 4 pmol∙s−1∙mL−1 is acceptable)
- 2 - Set the marks R1 for each chamber on 'Y1: O2 concentration'.
- 1 - After the stirrer test, the signal should stabilize within 40 min.
- Mark M: R1 - air calibration
- 3 - Open the O2 calibration window in menu 'Calibration' > 'Oxygen, O2'.
- 4 - Select Mark R1 for 'Air calibration'.
- 'POS signal: Recorded' should be 1 to 3 V at 25 to 37 °C (up to 1000 m above sea level; pb 101 to 90 kPa) at gain = 1.
- 'O2 slope neg.' should be within the range of -1 to 1 pmol∙s−1∙mL−1.
- 5 - Calibrate and copy to clipboard.
- 6 - Paste into the Excel file: "Template O2 calibration.xlsx".
- "Template O2 calibration.xlsx" is provided on the USB flash-drive (folder 'Oroboros O2k-Course on HRR\O2k\DL-Protocols') or can be opened from DatLab: Run_DL-Protocol/Set_O2_limit#Instrumental:_Browse_DL-Protocols_and_templates
- 7 - Proceed with event 1C.
- Event E: 1C - Close chamber
- 1 - After air calibration, close the chamber by gently pushing the stopper fully downwards.
- 2 - Siphon off excess medium from the top of the stopper using the Integrated Suction System (ISS).
- 3 - Check that any air bubbles are removed from the chamber.
- 4 - Switch to 'Y2: O2 slope neg.' by clicking on the Y2 label on the graph legend.
- 5 - Proceed with mark J°1.
- Event E: 1C - Close chamber
- Mark M: J°1 - O2 BG flux ~ air saturation (instrumental background flux after air calibration)
- 1 - Set a mark (J°1) after event 1C at a section, where the O2 slope is stable, and observe the signal.
- 'O2 slope neg.' should be within the range of ± 2 to 4 pmol∙s−1∙mL−1.
- 'O2 slope neg.' > 4 pmol∙s−1∙mL−1 may indicate a biological contamination in the medium or O2k-chamber.
- 2 - Save the file in menu 'File' > 'Save and disconnect' before starting an experiment.
- Although the calibration file is closed, the values will be automatically used as default calibration values for the next measurements.
- 1 - Set a mark (J°1) after event 1C at a section, where the O2 slope is stable, and observe the signal.
- Mark M: J°1 - O2 BG flux ~ air saturation (instrumental background flux after air calibration)
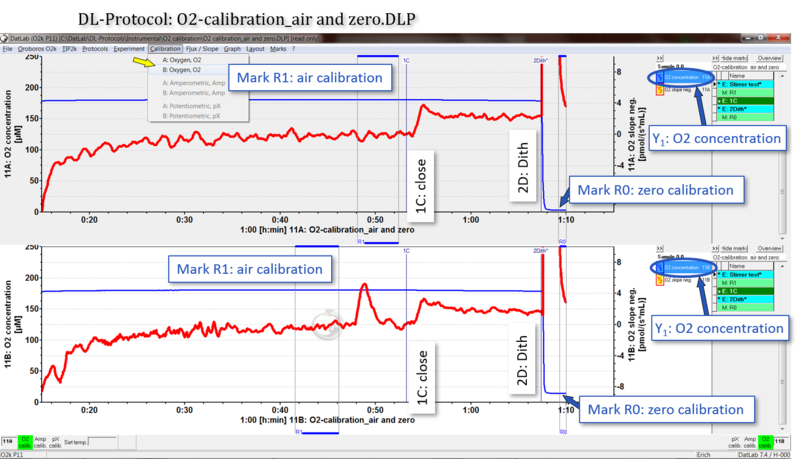
Air and zero calibration: O2-calibration_air and zero.DLP
- O2 sensor test and calibration at air saturation and zero oxygen:
- This DL-Protocol is identical in the section of air calibration, and continues with zero calibration as follows:
- Mark M: J°1 - O2 BG flux ~ air saturation (instrumental background flux after air calibration)
- 1 - Set a mark (J°1) after event 1C at a section, where the O2 slope is stable, and observe the signal.
- 'O2 slope neg.' should be within the range of 2 to 4 pmol∙s−1∙mL−1.
- 'O2 slope neg.' > 4 pmol∙s−1∙mL−1 may indicate a biological contamination in the medium or O2k-chamber.
- 2 - Switch to plot 'Y1: O2 concentration' by clicking on the Y1 label on the graph legend.
- 3 - Proceed with event 2Dith*.
- 1 - Set a mark (J°1) after event 1C at a section, where the O2 slope is stable, and observe the signal.
- Mark M: J°1 - O2 BG flux ~ air saturation (instrumental background flux after air calibration)
- Event E: 2Dith* - Manual dithionite titration
- 1 - Events 2Dith*: Inject fresh Na-dithionite solution ("zero solution") until the O2 signal is reduced close to 0 µM.
- A few minutes are required until a stable "zero" signal is obtained
- Repeat until the signal does not respond by a further decline. Siphon off excess medium from the stopper.
- 2 - Switch to plot 'Y1: O2 concentration' by clicking on the Y1 label on the graph legend.
- 3 - Proceed with mark R0.
- 1 - Events 2Dith*: Inject fresh Na-dithionite solution ("zero solution") until the O2 signal is reduced close to 0 µM.
- Event E: 2Dith* - Manual dithionite titration
- Mark M: R0 - Zero O2 calibration
- 1 - Set a mark (R0) after the last event 2Dith* when the signal is stable (Y1: O2 concentration).
- 2 - Open the O2 calibration window in menu 'Calibration' > 'Oxygen, O2'.
- 3 - Select mark R0 for 'Zero calibration'.
- R0 should be stable and < 2% of the signal at air saturation, but < 5% is acceptable.
- 4 - Select mark R1 for 'Air calibration'.
- 5 - Calibrate and copy to clipboard.
- 6 - Paste into the Excel file: "Template O2 calibration.xlsx".
- "Template O2 calibration.xlsx" is provided on the USB flash-drive (folder 'Oroboros O2k-Course on HRR\O2k\DL-Protocols') or can be opened from DatLab: Run_DL-Protocol/Set_O2_limit#Instrumental:_Browse_DL-Protocols_and_templates
- 7 - Save the file in menu 'File' > 'Save and disconnect' before starting the next file.
- After the calibration file is saved while connected to the O2k, the calibration parameters will be automatically used as default after restarting DatLab.
- Mark M: R0 - Zero O2 calibration
Oxygen calibration - general description
- The general description lists the calibration steps in further detail, without considering the convenience of using the instrumental DL-Protocols listed above.
- DatLab converts the oxygen signal of the polarographic oxygen sensor (OroborPOS or POS) to oxygen concentration during calibration comprising an air calibration (R1) and a zero calibration (R0).
- Appropriate calibration conditions are obtained in the O2k-chamber at experimental temperature.
- R1 and R0 are marked on the (blue) plot of oxygen concentration.
- The marks for R1 and R0 are pulled down in the O2 calibration window of DatLab.
- Click on Calibrate and copy to clipboard before closing the calibration window.
- Frequently, assumed hardware problems turn out to be a simple calibration problem.
- Air saturation is achieved by stirring the aqueous medium in contact with air in the O2k-chamber without sample.
- Add incubation medium into the chambers with an excess volume of at least 0.1 mL above the experimental chamber volume (2 mL or 0.5 mL) in order to fill the O2k-chamber and injection capillary of the stopper when it is fully inserted (closed). The volume does not have to be accurate, as long as it is above the minimum volume. Switch on the stirrers either during or after the addition of the medium.
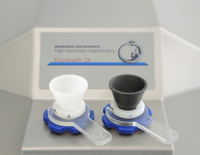
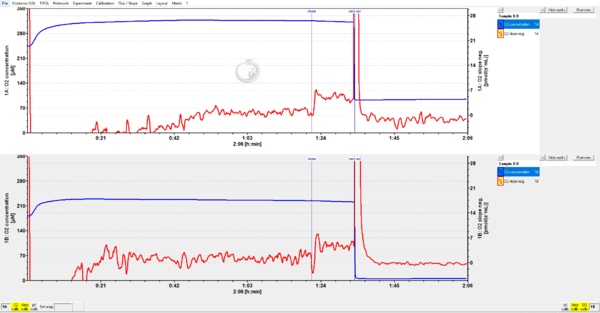
- Insert the stoppers slowly to their volume-calibrated position. Suck off excess medium ejected through the injection capillary and remaining in the well of the stopper. Then lift the stoppers using the stopper-spacer tool, leaving a gas volume above the liquid phase for final air equilibration - Open chamber position. The central level of the gas phase remains above the rotating stirrer bar, preventing bubbles and foam from being formed which would block gas exchange. To ensure a well-defined pO2 in the gas phase, the gas volume has to be renewed (exchanged for air), if the medium was originally not near air saturation. This is achieved simply by fully inserting and re-opening the stopper. Equilibration is a slow process: stability should be reached within one hour (figure to the right). A stirrer test [F9] is performed early during equilibration.
- After stabilization of the POS signal, the recorded signal at air saturation, R1, is about 1-3 V (at Gain 1) and a temperature of 25-37 °C. A signal of 1 V corresponds to a signal current of the POS of 1 µA (corresponding to 2 V at Gain 2). Under all experimental conditions, the raw signal must be <10 V. Continue recording for 3-10 min to check for signal stability. You may proceed at this point with an O2 background test (see below).

- Zero oxygen calibration may be achieved by chemical or biological depletion of oxygen. (1) Chemical: Following chamber assembly or exchange of the POS membrane, zero solution (Na-dithionite, OroboPOS-Service Kit) is titrated into the chamber, which is part of the automatic TIP2k-supported instrumental background test (MiPNet14.06). (2) Biological: Zero calibration can be performed with mitochondria or cell suspensions that allow complete oxygen depletion.
Air calibration in DatLab
- 1. Select Graph layout:
- Go to menu Layout, check O2 and from Standard layouts select 01 Calibration show Temp.
This is typically the first layout used after switching on the O2k. Oxygen concentration (blue plots, left Y-axis) and O2 slope (not corrected for instrumental background; red plots, right Y-axis) are displayed on the top graph (left O2k-chamber), and middle graph (right O2k-chamber). The third graph (bottom) shows the block temperature on the left Y-axis and the Peltier power on the right Y-axis. Only when both temperature and Peltier power are constant, the chambers have reached thermal equilibrium. The next step is to observe equilibration of the oxygen signal with a defined gas phase above the stirred aqueous phase ('open' chamber; usually with air as the first step) to perform an oxygen calibration.
- 2. Mark
- Mark a section of the experiment at air saturation, when signal stability is reached. This should be done in real-time to save default calibration information. Corrections are possible after disconnecting from the O2k. For calibration, follow steps (1) to (5):
- Select a graph by a click (left mouse button) into the graph or directly by step 2.
- Select the oxygen signal as the active plot by a click on Y1 in the figure legend on the right of the graph. The active plot is highlighted.
- Only if Mouse Control: Zoom mode has been activated: Select Mouse Control: Mark in the Graph menu or press [Ctrl+M].
- Set a mark: Hold [Shift] and click the left mouse button, move the cursor along the time axis, release the left mouse button at the end of the section to be marked. Remove a section of the mark or the total mark: Move the cursor with [Shift+right-click] along the time axis, release the mouse button at the end of the section of the mark to be deleted.
- Rename the mark: Left mouse click on the bar of the mark. Rename the mark for air calibration as “R1” (and the mark for zero calibration as “R0”).
- 3. Calibrate
- Open the DatLab calibration window by double clicking on O2 calib. for O2k-chamber A or B in the O2k-status line (bottom left and right). Alternatively, press [F5] to open the calibration window for the active plot.
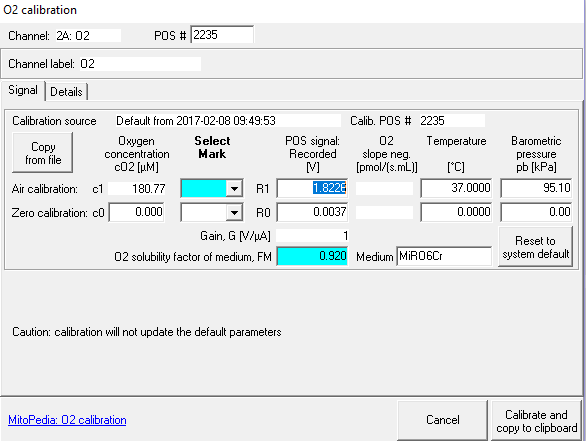
- Left click on the pull-down button and select the appropriate mark R1. The average voltage (Raw signal [V]) recorded over the marked section is shown in the corresponding field on the right. The corresponding signal stability is displayed as the uncorrected negative slope of the signal during calibration in [pmol∙s−1∙mL−1]. Temperature and barometric pressure are displayed as measured over the marked section. Calibration values R1 and R0 can be edited numerically, without exerting an influence on c1. If the temperature or barometric pressure are edited, then c1 is recalculated for the changed conditions.
- If not set previously, enter the oxygen solubility factor of the medium, FM, relative to pure water. For more info on this factor: MiPNet06.03 POS-calibration-SOP. For documentation purposes, enter the name of the experimental incubation medium in the corresponding field.
- Left click on Calibrate and copy to clipboard. After clicking on this button all changes in the entire calibration window are applied. The entire plot of oxygen concentration is re-calibrated [µM = nmol/mL], and the corresponding negative slope or volume-specific oxygen flux [pmol∙s−1∙mL−1] is now based on this new calibration. Click on Calibrate and copy to clipboard before closing the calibration window. Thereby, calibration is activated and calibration parameters are automatically copied to clipboard for entry into the spreadsheet "Template O2 calibration.xlsx".
Zero calibration in DatLab
- 1. Mark
- Mark a section of the experiment after full depletion of oxygen, when signal stability is reached. This should be done in real-time to save default calibration information. Corrections are possible after disconnecting from the O2k. For calibration, follow steps (1) to (5):
- Select a graph by a click (left mouse button) into the graph or directly by step 2.
- Select the oxygen signal as the active plot by a click on Y1 in the figure legend on the right of the graph. The active plot is highlighted.
- Only if Mouse Control: Zoom mode has been activated: Select Mouse Control: Mark in the Graph menu or press [Ctrl+M].
- Set a mark: Hold [Shift] and click the left mouse button, move the cursor along the time axis, release the left mouse button at the end of the section to be marked. Remove a section of the mark or the total mark: Move the cursor with [Shift+right-click] along the time axis, release the mouse button at the end of the section of the mark to be deleted.
- Rename the mark: Left mouse click on the bar of the mark. Rename the mark for zero calibration as “R0”.
- 2. Calibrate
- Open the DatLab calibration window by double clicking on O2 calib. for O2k-chamber A or B in the O2k-status line (bottom left and right). Alternatively, press [F5] to open the calibration window for the active plot.
- Left click on the pull-down button and select the appropriate mark R0. Many times the zero calibration value is used from a previous experiment. The displayed temperature and pressure are without influence on the calibration calculations for zero oxygen. The stable zero signal, R0, should be <2 % of the signal at air saturation, but <5 % is acceptable. Most importantly, the zero signal must be stable. The average voltage (Raw signal [V]) recorded over the marked section is shown in the corresponding field on the right. The corresponding signal stability is displayed as the uncorrected negative slope of the signal during calibration in [pmol∙s−1∙mL−1]. Temperature and barometric pressure are displayed as measured over the marked section. Calibration values R1 and R0 can be edited numerically, without exerting an influence on c1. If the temperature or barometric pressure are edited, then c1 is recalculated for the changed conditions.
- If not set previously, enter the oxygen solubility factor of the medium, FM, relative to pure water. For more info on this factor: MiPNet06.03 POS-calibration-SOP. For documentation purposes, enter the name of the experimental incubation medium in the corresponding field.
- Left click on Calibrate and copy to clipboard. After clicking on this button all changes in the entire calibration window are applied. The entire plot of oxygen concentration is re-calibrated [µM = nmol/mL], and the corresponding negative slope or volume-specific oxygen flux [pmol∙s−1∙mL−1] is now based on this new calibration. Calibration parameters are automatically copied to clipboard for entry into the spreadsheet "Template O2 calibration.xlsx".
DatLab calibration: real-time vs. disconnected
- DatLab uses calibration values applied in real-time (connected to the O2k, recording data) as default values for future experiments. When calibration values are edited in the disconnected mode, they apply only to the current file and will not be used as a new default in experiments. This allows to re-calibrate old files without overwriting the current default values for calibration. Ideally, calibration values that should be used as new defaults are applied in real-time when the experiment is still running. If the DatLab-calibration is performed after disconnecting, these calibration parameters can be read into other DatLab files using the "Copy from file" function and "Calibrate and copy to clipboard".
- Before disconnecting the O2k from DatLab, calibration information is automatically saved and available upon re-connecting the O2k, even if you exit DatLab and start the program again. The current calibration parameters are displayed when opening the O2 calibration window [F5].
Calibration and quality control
- Oxygen sensor test
- The oxygen sensor test starts in an open chamber.
- 1. Before final equilibration, perform a stirrer test [F9], switching both stirrers automatically off for 30 s.
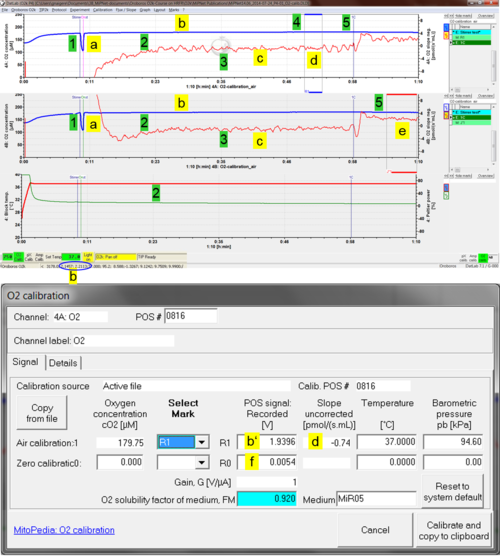
- 2. About 20 minutes are required for air equilibration after temperature equilibration of the incubation medium, visualized as stabilization of the Peltier power (Fig. Quality control; time scale is 01:10 hh:mm).
- Quality control label a: Upon automatic re-start of the stirrer (On), the increase of the oxygen signal should be rapid and monoexponential.
- Quality control label b: The raw signal (blue plot; 1 V = 1 µA at Gain 1) should be 1 to 3 V at 25 to 37 °C at sea level up to 1000 m (pb 101 to 90 kPa). At a Gain setting of 2 the raw signal [V] is multiplied by 2.
- 3. Within 40 minutes, the oxygen signals should be stable with an O2 slope (uncorrected) close to zero.
- Quality control label c: Signal noise should be low, reflected in a noise of the O2 slope (red plot) within ± 2 (± 4 is acceptable) pmol∙s−1∙mL−1 at a data recording interval of 2 s and 40 data points selected for calculation of the slope.
- 4. Set a mark on the oxygen signal (R1) and click on O2 Calib. to open the DatLab O2 calibration window (MiPNet06.03 POS-calibration-SOP).
- Quality control label d: The slope uncorrected should be within ± 1 pmol∙s−1∙mL−1 averaged across the section of the experiment marked as R1 for air calibration (d). The recorded POS signal should be close to the previous calibration under identical experimental conditions. See O2-Calibration window (see Fig. right, label b’).
- 5. Close the chamber and if required, perform a zero oxygen calibration.
- Quality control label e: After closing the chamber, select plot Y2 and set mark J°1. O2 slope neg. should be within 3.0 ± 1 pmol∙s−1∙mL−1.
- O2 slope neg. values higher than 4.0 pmol∙s−1∙mL−1 indicate:
- » Biological contamination.
- » Air bubbles in the Closed chamber: switch on the illumination of the O2k and inspect the O2k-Chamber through the front window. Remove any air bubbles.
- » A large volume of medium collected in the receptacle of the stopper: siphon off excess medium.
- » A larger chamber volume: check O2k-Chamber volume calibration.
- O2 slope neg. values higher than 4.0 pmol∙s−1∙mL−1 indicate:
- Quality control label f: The zero signal at mark R0 for zero calibration should be <2 % of R1 (stable at <5 % is acceptable).
- 3. Within 40 minutes, the oxygen signals should be stable with an O2 slope (uncorrected) close to zero.
O2-sensor test: when?
- An O2-sensor test should be performed:
- After switching on the O2k, every day: air calibration, stirrer test, quality control (Calibration and quality control).
- Zero oxygen calibration: from time to time over weeks; bracketing zero oxygen calibrations when working at low oxygen (Zero calibration).
- After application of a new membrane and O2-sensor service: in some cases, the signal of the OroboPOS improves (higher signal stability, less noise, shorter response time) when the O2k remains switched on overnight (O2k-Chambers filled with 70 % EtOH or H2O if the traces will be evaluated in the morning).
- For O2k-Quality Control (O2k-QC) of instrumental performance.
- Before an O2k-chamber test (Instrumental O2 background test).
- During troubleshooting procedures, when switching components between the two chambers, a quick sensor test is performed after each step (stirrer test, sensor signal).
- Dynamic POS calibration = Calibration of the response time of the POS.
- Static POS calibration = Two-point calibration of the polarographic oxygen sensor.
Instrumental background oxygen flux - general
- Instrumental background oxygen flux derives from oxygen fluxes into or out of the respirometer chamber that are not directly related to respiratory activity of the sample. These fluxes are caused by back diffusion into the chamber at low oxygen pressure, oxygen diffusion out of the chamber at elevated oxygen levels, and oxygen consumption by the polarographic oxygen sensor (OroboPOS). Correction for instrumental background oxygen flux is a standard in high-resolution respirometry, performed by DatLab. Background measurements provide quality control of instrument function. In the Oroboros O2k, background corrections are usually within a few % of experimental flux over the entire experimental oxygen range. At minimum activities, however, even the small background effects become significant and require compliance to standard operating procedures described here.
- Instrumental O2 background tests can be perfomed using the TIP2k or with manual injections. Detailed instructions are provided here: MiPNet14.06_Instrumental_O2_background
- Following the preparation of necessary solutions as described in MiPNet14.06_Instrumental_O2_background and loading and mounting of the syringes (when the TIP2k is used) the appropriate DatLab protocol should be used: Run DL-Protocol/Set O2 limit
Troubleshooting
* Customer ID: Erzsebet Polyak, University of Wisconsin at Madison
- Question 1: We have different oxygen levels in chamber A and B.
- Question 2: In chamber A after adding dithionite the signal does not go down below 100 µM.
- Answer 1: Different initial oxygen levels after switching on the instrument are due to missing calibration. Sensors need to be air calibrated on each experimental day to account for changes in barometric pressure or to accommodate changes in experimental temperature or medium.
- Answer 2: The zero voltage in chamber A is at 0.8996 V, which is too high. Zero voltage should not exceed 5 % (usually lower than 2 %) of the voltage obtained at air saturation (R1). You should perform a complete POS service.
Keywords: Oxygen signal
- Bioblast links: Oxygen signal - >>>>>>> - Click on [Expand] or [Collapse] - >>>>>>>
- Specific
- O2k-Procedures
- MiPNet O2k-Procedures
- General
- » Oxygen, dioxygen, O2
- » Oxygen calibration - DatLab
- » Oxygen solubility
- » Oxygen solubility factor
- » Oxygen pressure
- » Concentration
- » Activity
- » Pressure - Pascal
- » Barometric pressure
- » High-resolution respirometry
- » OroboPOS
- » Polarographic oxygen sensor
- » MitoFit Quality Control System
- » Sensitivity
- General
- Other keyword lists
Labels: MiParea: Instruments;methods
HRR: Oxygraph-2k, O2k-Fluorometer, O2k-Protocol
DatLab, DL7, DL6a7
MitoPedia methods:
Respirometry
MitoPedia O2k and high-resolution respirometry:
DatLab

