Bosy-Westphal 2009 Br J Nutr
| Bosy-Westphal A, Plachta-Danielzik S, Dörhöfer RP, Müller MJ (2009) Short stature and obesity: positive association in adults but inverse association in children and adolescents. Br J Nutr 102:453-61. |
Bosy-Westphal A, Plachta-Danielzik S, Doerhoefer RP, Mueller MJ (2009) Br J Nutr
Abstract: Shorter than average adults are at a higher risk for obesity and are also more susceptible to diabetes and CVD, independent of BMI. In contrast, taller children have a higher risk of obesity. We hypothesised that short stature is related to adverse body composition and that the association between stature and obesity differs between generations. In a cross-sectional German database of 213 804 adults and 12 411 children and adolescents, the prevalence of overweight and obesity was compared between percentiles of height. The association between stature and percentage of fat mass (%FM), lean BMI (LBMI; kg/m2) or waist:hip ratio (in children only) was analysed within BMI groups. In adults, the prevalence of BMI >30 kg/m2 gradually increased with decreasing percentile of height whereas in children and adolescents, a positive association between height and weight status was observed. Short-stature women and girls had a 0.8-3.2 % lower %FM than tall subjects (P < 0.05), whereas no trend for %FM was observed in males. When compared with tall subjects, LBMI was 0.2-0.6 kg/m2 lower in short-stature men, as well as obese women (P < 0.05). There was a non-significant trend for a lower LBMI and a higher waist:hip ratio in shorter children. In conclusion, short stature is associated with an increased risk of obesity in adults. Cardiometabolic risk in short stature is not explained by an adverse body composition.
• Bioblast editor: Gnaiger E
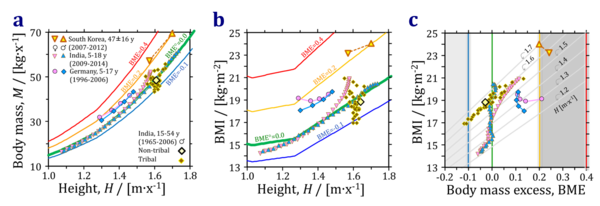
From BMI to BME
Work in progress by Gnaiger E 2020-02-05 linked to a preprint in preparation on BME and mitObesity.

References
- Bosy-Westphal A, Plachta-Danielzik S, Dörhöfer RP, Müller MJ (2009) Short stature and obesity: positive association in adults but inverse association in children and adolescents. Br J Nutr 102:453-61.
- Hood K, Ashcraft J, Watts K, Hong S, Choi W, Heymsfield SB, Gautam RK, Thomas D (2019) Allometric scaling of weight to height and resulting body mass index thresholds in two Asian populations. Nutr Diabetes 9:2. doi: 10.1038/s41387-018-0068-3. - »Bioblast link«
- Indian Academy of Pediatrics Growth Charts Committee, Khadilkar V, Yadav S, Agrawal KK, Tamboli S, Banerjee M, Cherian A, Goyal JP, Khadilkar A, Kumaravel V, Mohan V, Narayanappa D, Ray I, Yewale V (2015) Revised IAP growth charts for height, weight and body mass index for 5- to 18-year-old Indian children. Indian Pediatr 52:47-55.
Labels: MiParea: Exercise physiology;nutrition;life style
Pathology: Obesity
BMI, BME, Fat
